<!DOCTYPE html>
<meta charset="utf-8">
<style>

body {
  font: 10px sans-serif;
}

.axis path,
.axis line {
  fill: none;
  stroke: #000;
  shape-rendering: crispEdges;
}

.x.axis path {
   stroke: #000;
}

.line {
  fill: none;
  stroke: steelblue;
  stroke-width: 1px;
}

.grid .tick {
    stroke: lightgrey;

}
.grid path {
      stroke-width: 0;
}
svg{
border-style:solid;
border-color:lightgrey;
border-width:1px;
}
.overlay {
  fill: none;
  pointer-events: all;
}

.focus circle {
  fill: none;
  stroke: steelblue;
}

</style>
<body>
<script src="http://d3js.org/d3.v3.js"></script>
<script>

var margin = {top: 20, right: 30, bottom: 30, left: 40},
    width = 483 - margin.left - margin.right,
    height = 291 - margin.top - margin.bottom;
var parseDate = d3.time.format("%d.%m.%Y %H:%M:%S").parse;
    bisectDate = d3.bisector(function(d) { return d.date; }).left,
    formatValue = d3.format(",.2f"),
    formatCurrency = function(d) { return formatValue(d) + " C°"; };

var x = d3.time.scale()
    .range([0, width]);

var y = d3.scale.linear()
    .range([height, 0]);

var xAxis = d3.svg.axis()
    .scale(x)
    .orient("bottom")
    .tickFormat(d3.time.format("%H"));

var yAxis = d3.svg.axis()
    .scale(y)
    .orient("left");

var line = d3.svg.line()
    .x(function(d) { return x(d.date); })
    .y(function(d) { return y(d.outdoor); });

var svg = d3.select("body").append("svg")
    .attr("width", width + margin.left + margin.right)
    .attr("height", height + margin.top + margin.bottom)
  .append("g")
    .attr("transform", "translate(" + margin.left + "," + margin.top + ")");

function make_x_axis() {
    return d3.svg.axis()
        .scale(x)
         .orient("bottom")
         .ticks(5)
}

function make_y_axis() {
    return d3.svg.axis()
        .scale(y)
        .orient("left")
        .ticks(5)
}
d3.csv("day_od.csv", function(error, data) {
  data.forEach(function(d) {
    d.date = parseDate(d.date);
    d.outdoor = +d.outdoor;
  });
data.sort(function(a, b) {
    return a.date - b.date;
  });

  x.domain(d3.extent(data, function(d) { return d.date; }));
  y.domain(d3.extent(data, function(d) { return d.outdoor; }));

svg.append("g")
        .attr("class", "grid")
        .attr("transform", "translate(0," + height + ")")
        .call(make_x_axis()
            .tickSize(-height, 0, 0)
            .tickFormat("")
        )

    svg.append("g")
        .attr("class", "grid")
        .call(make_y_axis()
            .tickSize(-width, 0, 0)
            .tickFormat("")
        )
  svg.append("g")
      .attr("class", "x axis")
      .attr("transform", "translate(0," + height + ")")
      .call(xAxis);

  svg.append("g")
      .attr("class", "y axis")
      .call(yAxis)
    .append("text")
      /*.attr("transform", "rotate(-90)")*/
      .attr("y", -7)
      .attr("x", 0)
      /*.style("text-anchor", "end")*/
      .text("Outside C°");

  svg.append("path")
      .datum(data)
      .attr("class", "line")
      .attr("d", line);
  var focus = svg.append("g")
      .attr("class", "focus")
      .style("display", "none");

  focus.append("circle")
      .attr("r", 4.5);

  focus.append("text")
      .attr("x", 9)
      .attr("dy", ".35em");

  svg.append("rect")
      .attr("class", "overlay")
      .attr("width", width)
      .attr("height", height)
      .on("mouseover", function() { focus.style("display", null); })
      .on("mouseout", function() { focus.style("display", "none"); })
      .on("mousemove", mousemove);

  function mousemove() {
    var x0 = x.invert(d3.mouse(this)[0]),
        i = bisectDate(data, x0, 1),
        d0 = data[i - 1],
        d1 = data[i],
        d = x0 - d0.date > d1.date - x0 ? d1 : d0;
    focus.attr("transform", "translate(" + x(d.date) + "," + y(d.outdoor) + ")");
    focus.select("text").text(formatCurrency(d.outdoor));
  }
});

</script>


 utdoor:50:50:VAL:1.0:blue:red:-20.0:20.0:C

 Perliä ei kyllä voi suositella kenellekään jos meinaa jotain isompaa ohjelmoida...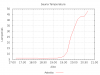
 Kaipa tuota gnuplottiakin voisi viritellä, mutta deafulttina se tekee kyllä melko ankean näköistä jälkeä.